Dashboard Designer
Dashboards are built in the Dashboard Designer: place widgets from the palette on a grid, configure them, define who sees the dashboard, and publish it. Every change is saved automatically as a draft; viewers always see the last published version. Access is granted to anyone with the role View process designer or Manage process designer.
The list
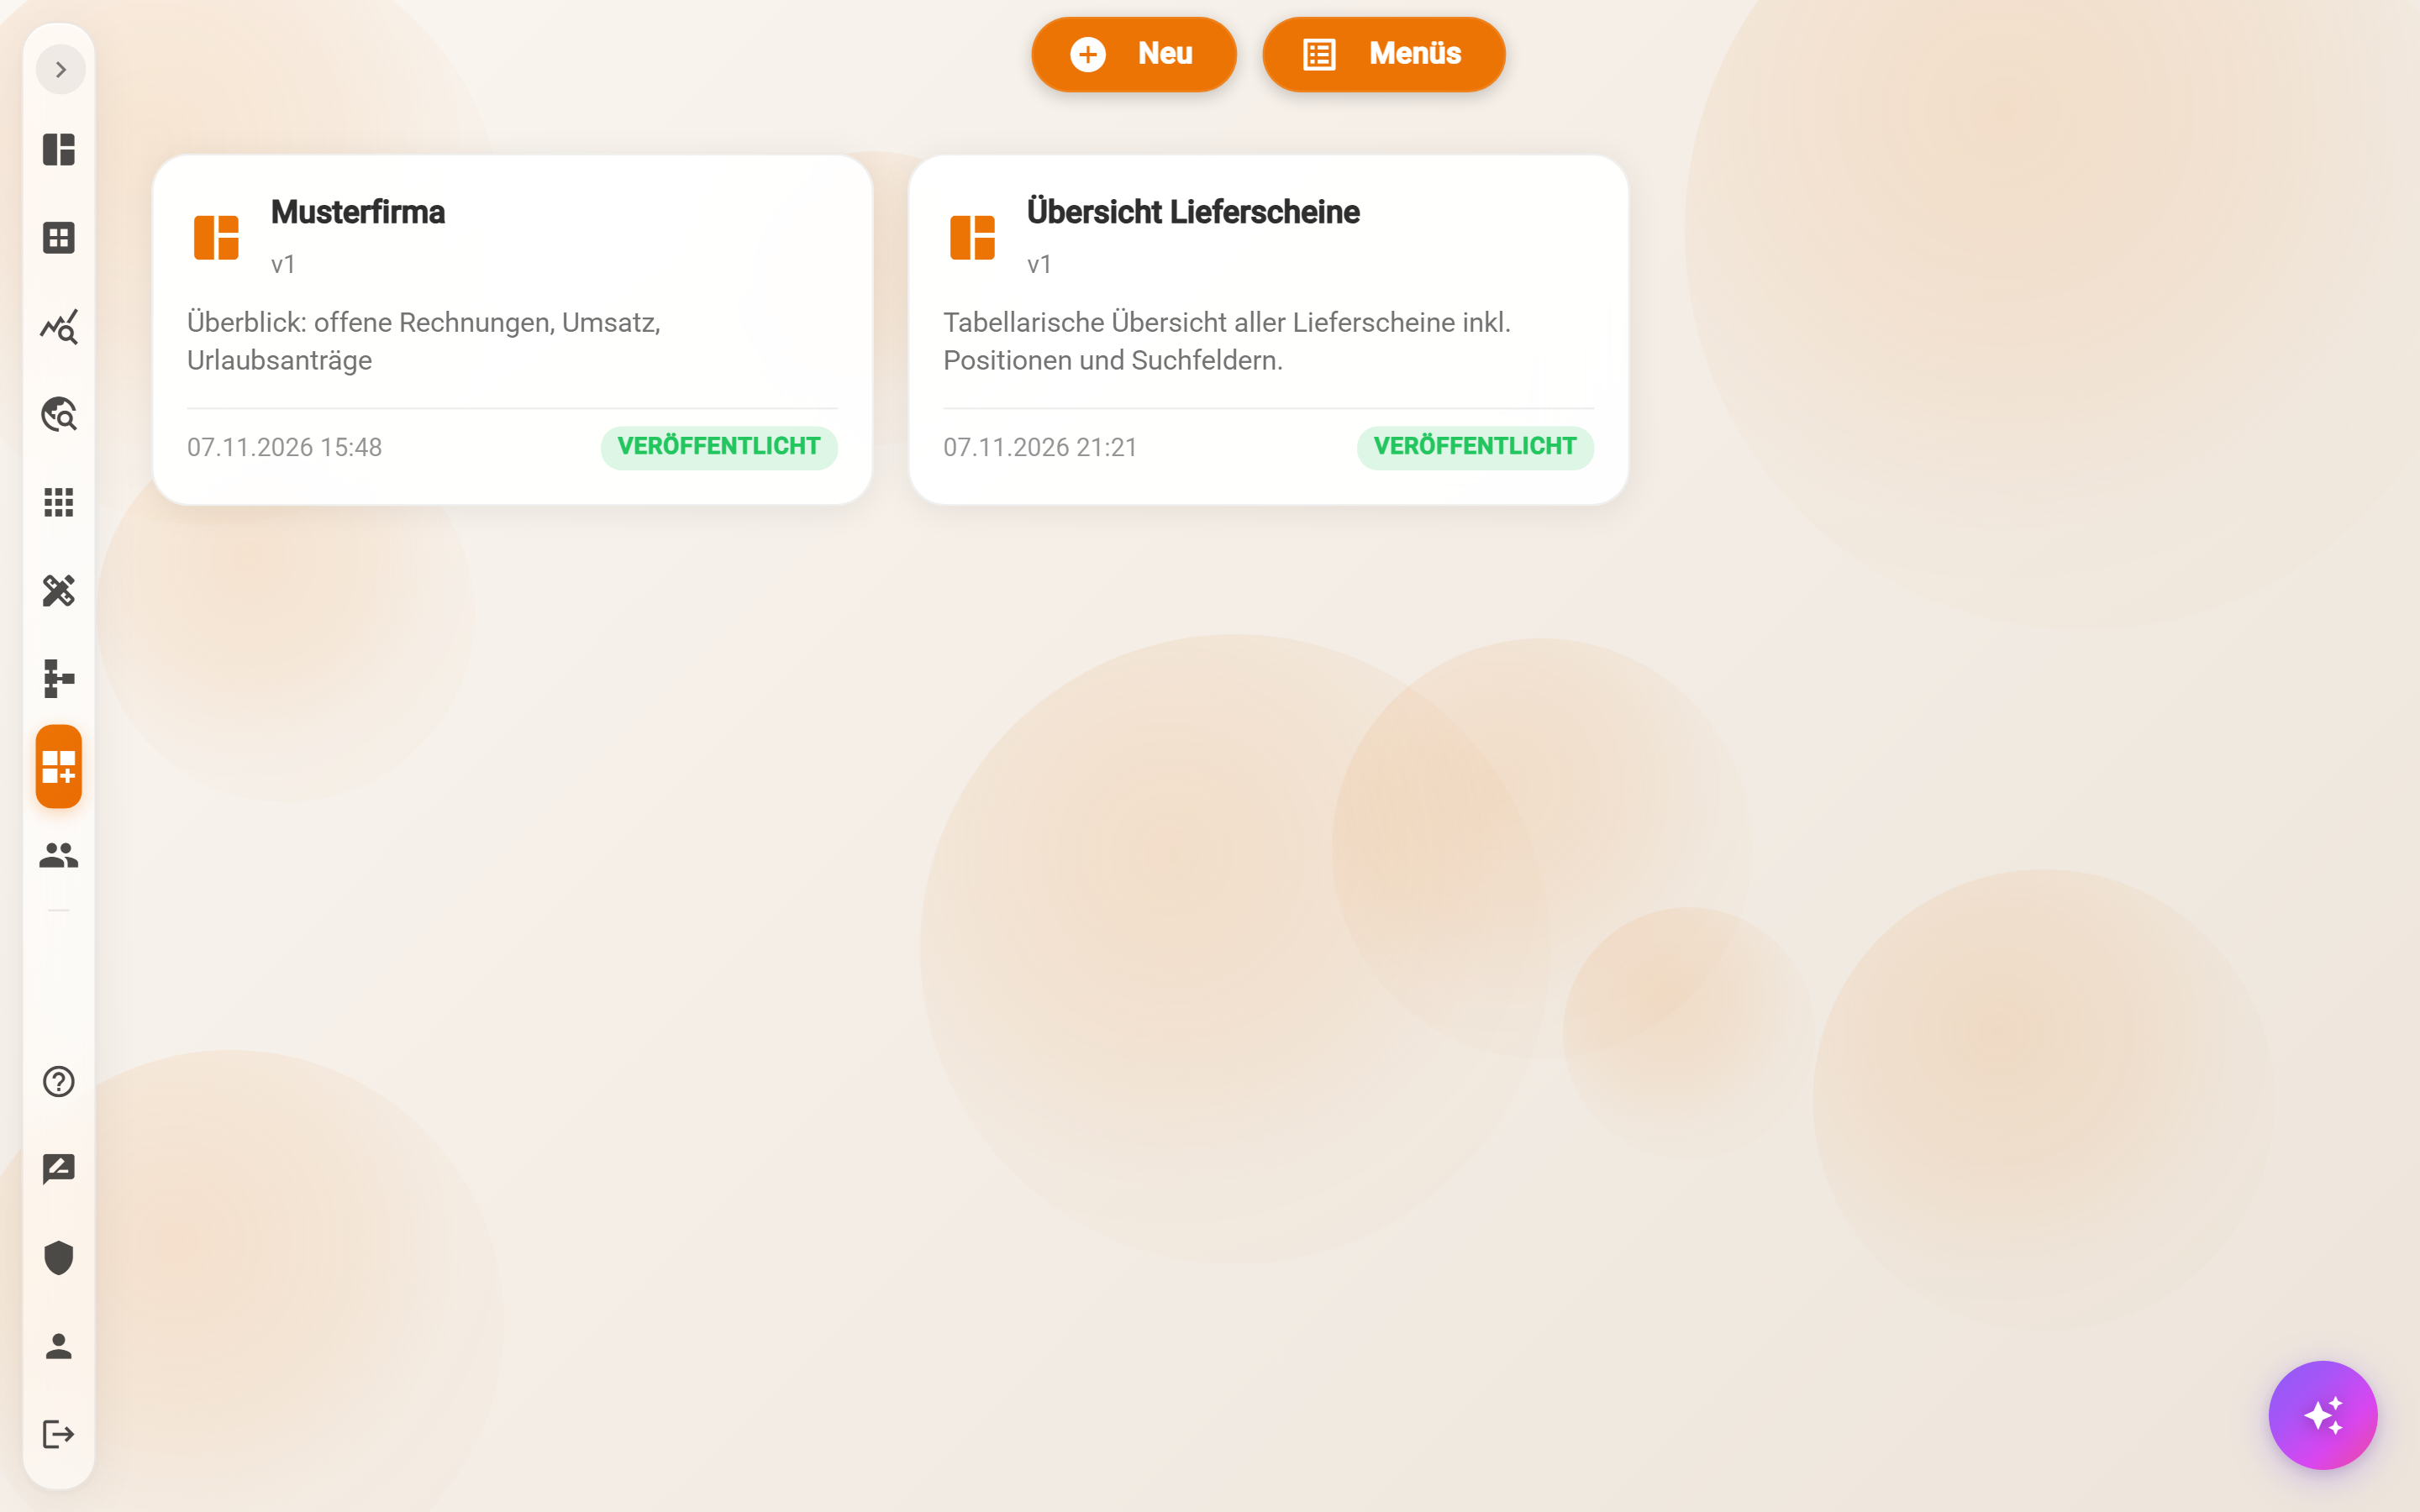
Each card shows icon, name, version number, description, date of the last change and the badge Published or Draft. A click opens the editor. At the top: New creates a dashboard, Menus leads to the custom navigation menus; with many dashboards, Search dashboards helps.
New opens the dialog Create new dashboard with Name, Icon (a Material icon name such as space_dashboard) and Description. Create creates the draft and opens the editor.
The editor
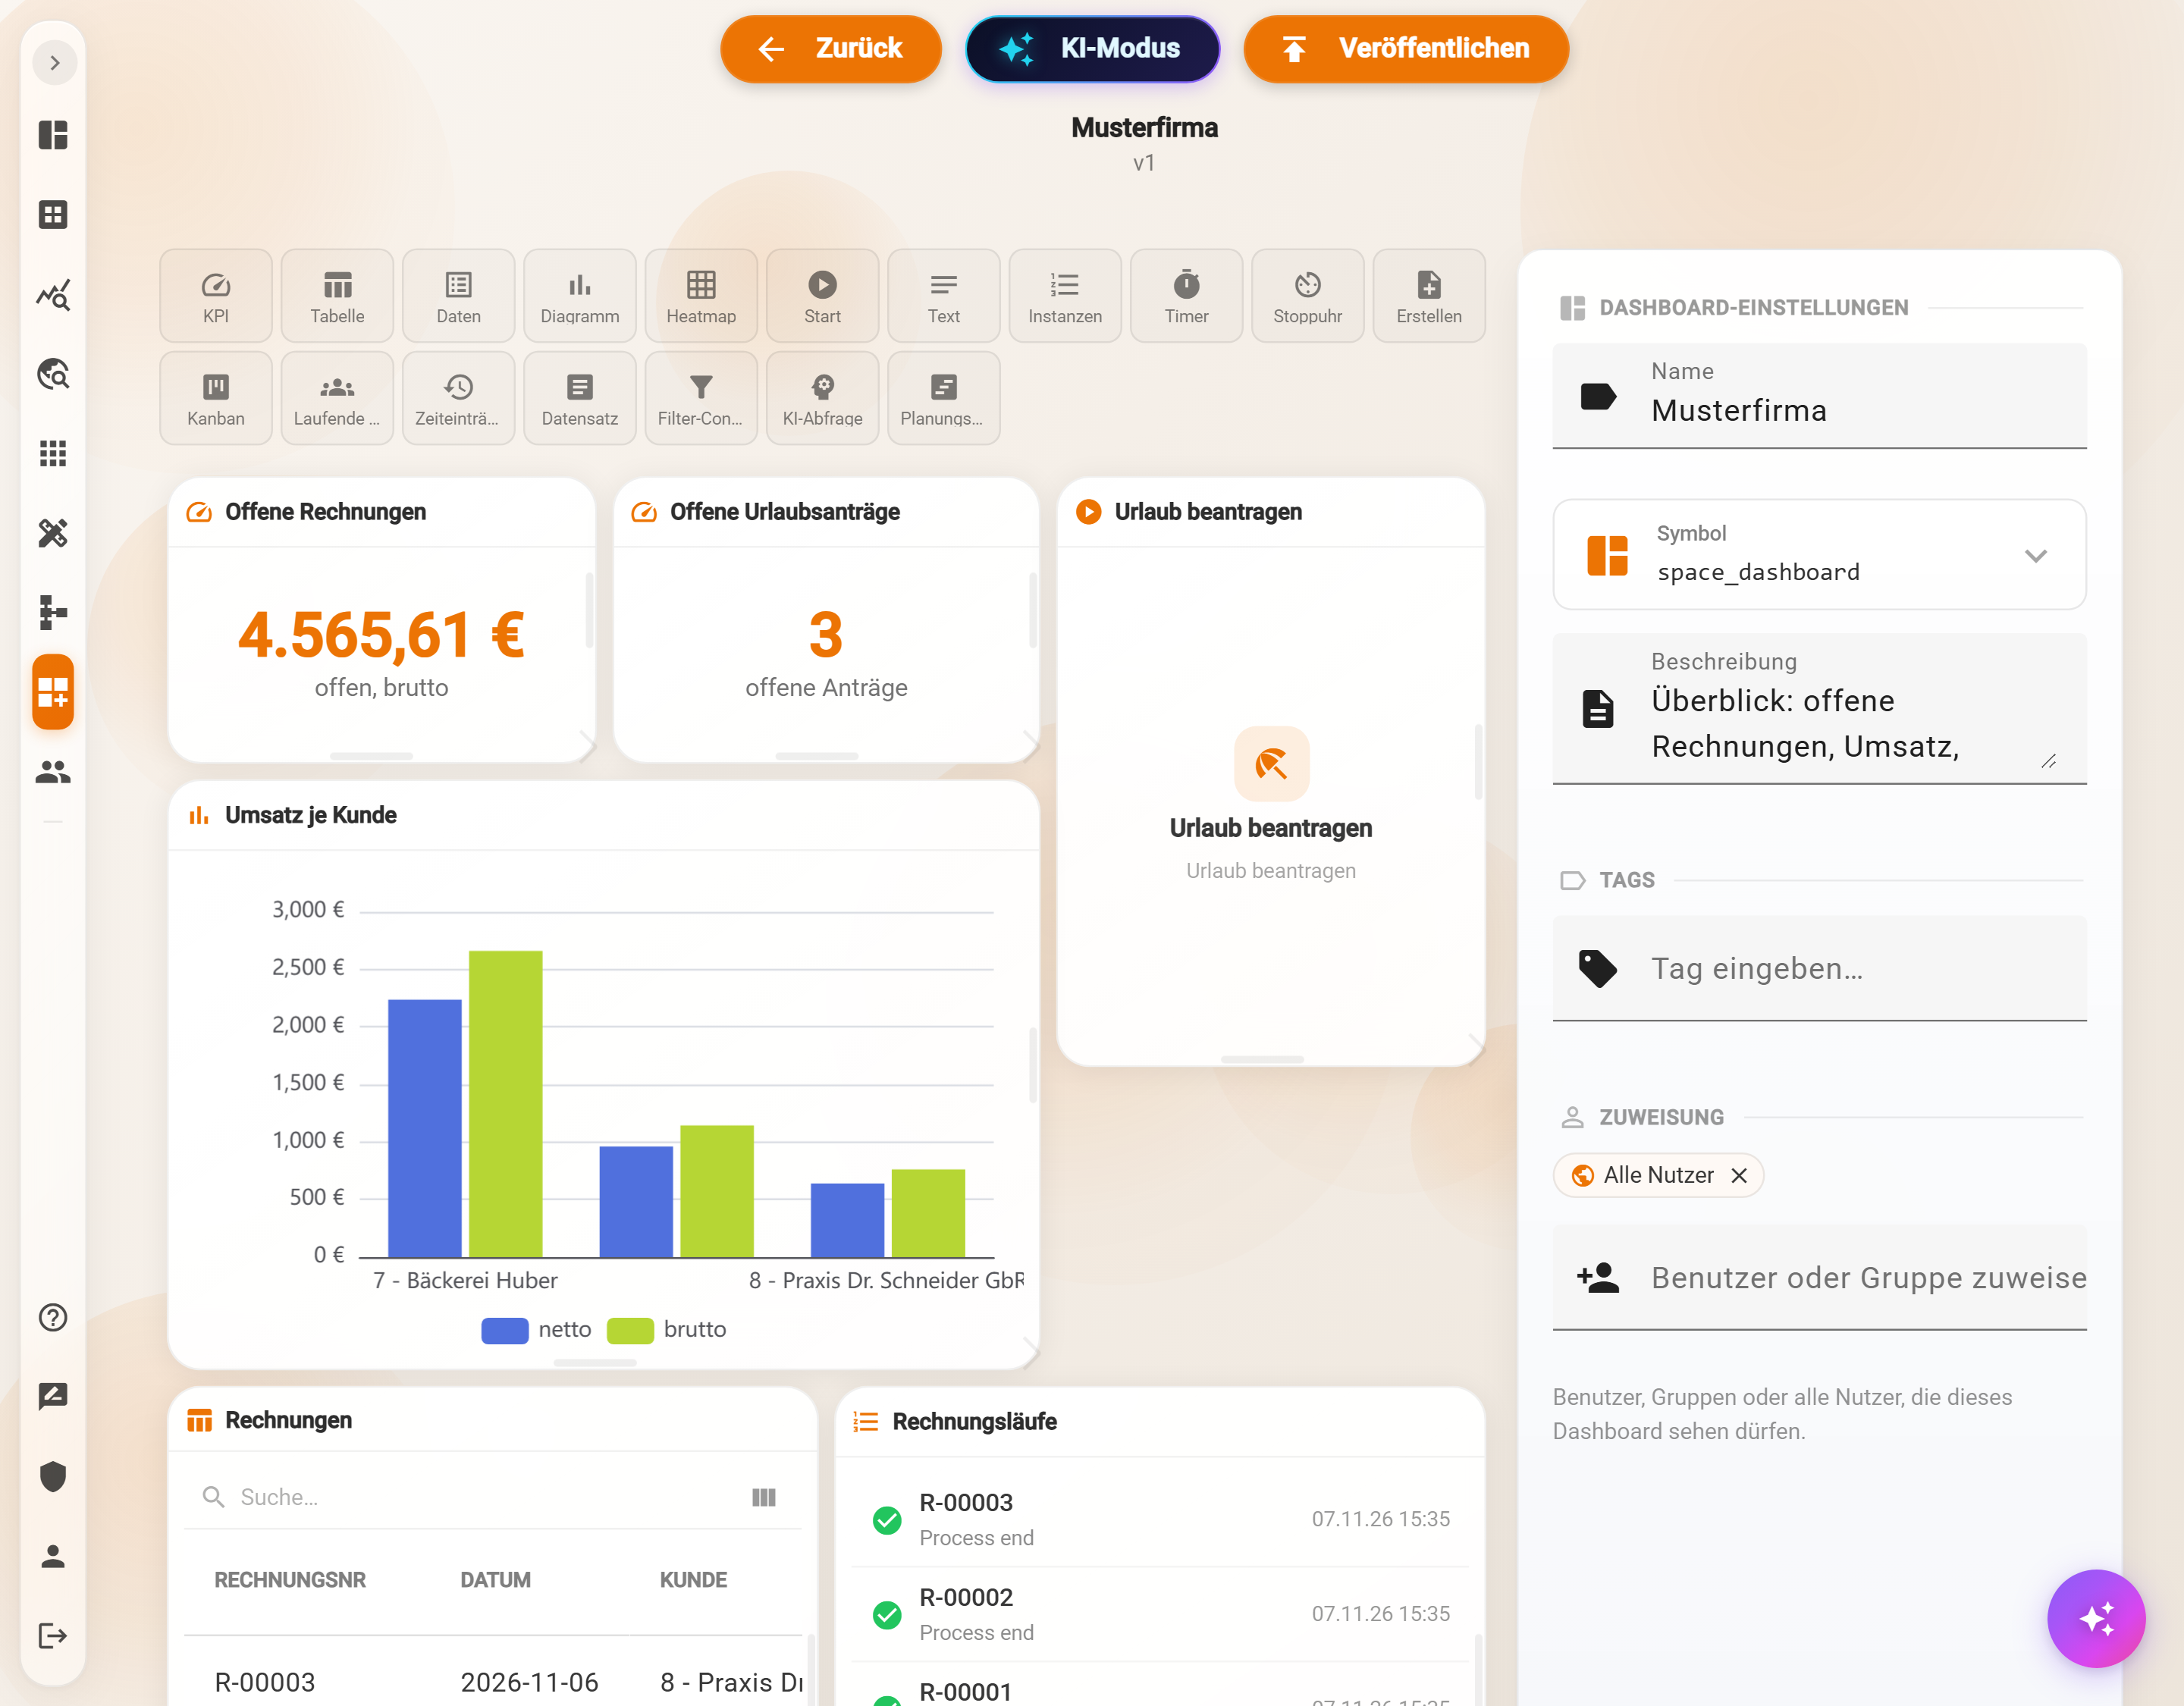
- Toolbar: Back to the list, AI mode, Publish. Below the name it says Saving… or Saved: changes are saved as a draft on their own after a few seconds. The menu More actions contains Versions, Export JSON, Unpublish and Delete.
- Palette: 18 widgets, one click places one on the grid. The names are kept short: Data is the Data list, Start the Start process, Instances the Process instances, Create the creation of a record, Timer the Time tracking. What each widget can do is described in the overview.
- Grid: six columns, rows of 80 pixels in height, free placement with gaps. A widget is moved by its header, its size is changed at the bottom and right edge and at the corner. When dragged over another widget, the dragged one jumps past it instead of pushing it away. The X in the header removes a widget after confirmation.
- Settings on the right: without a selection the Dashboard settings, with a selection the settings of the widget.
Configuring a widget
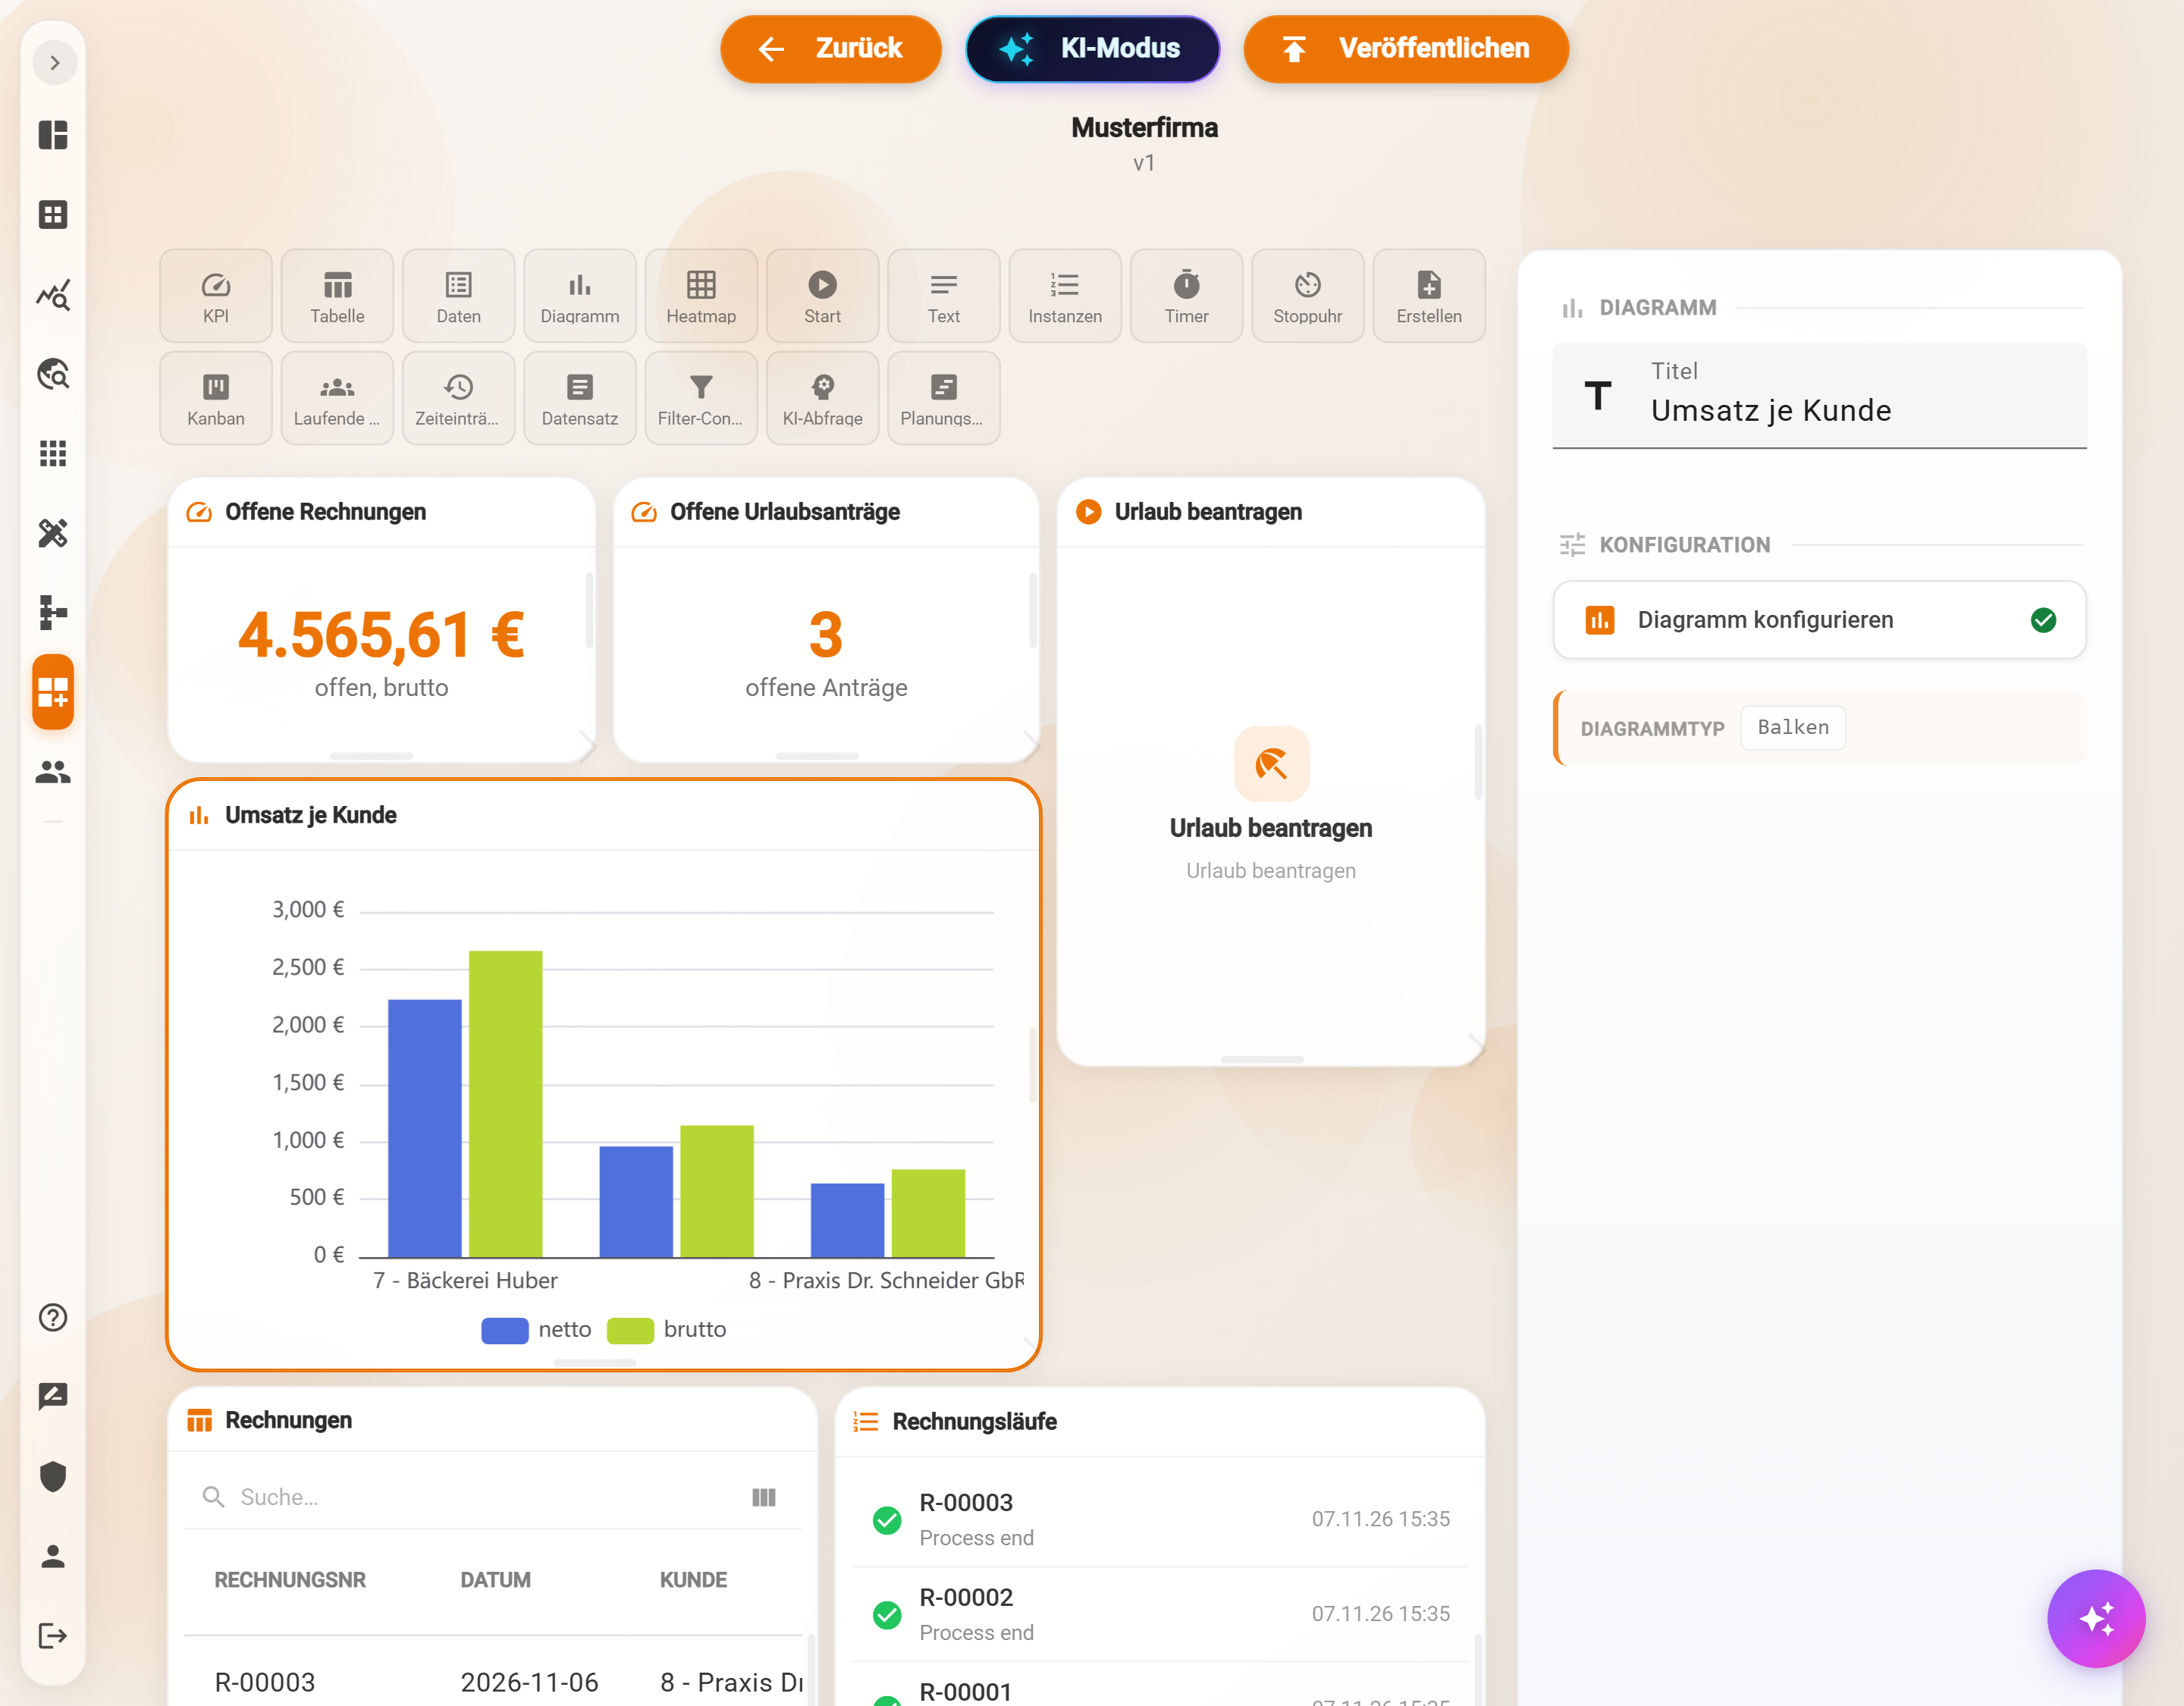
A click on a widget shows its type, the Title and the Configuration on the right. Simple widgets have their fields directly in the panel, such as the data schema of the Data list. Complex widgets open their own dialog with several steps via Configure …, for example Chart, Table, Kanban, Heatmap, Time tracking or Planning board; a green check mark shows that a configuration exists, below it the most important chosen values are listed. Under Position & size, Width and Height can be entered in grid cells and the widget moved with arrows, which helps on a tablet. The details of each widget are on its own page, the SQL rules under SQL in widgets.
Dashboard settings and assignment
Without a selected widget the panel shows Name, Icon, Description, Tags and the Assignment. Individual users, groups or All users are assigned, as chips; Assign user or group searches as you type. Whoever creates the dashboard is assigned automatically. Without an assignment nobody sees the dashboard in the workspace, not even administrators; in the Designer it remains editable for everyone with access. The assignment takes effect immediately on the published version.
Publishing, versions, unpublishing
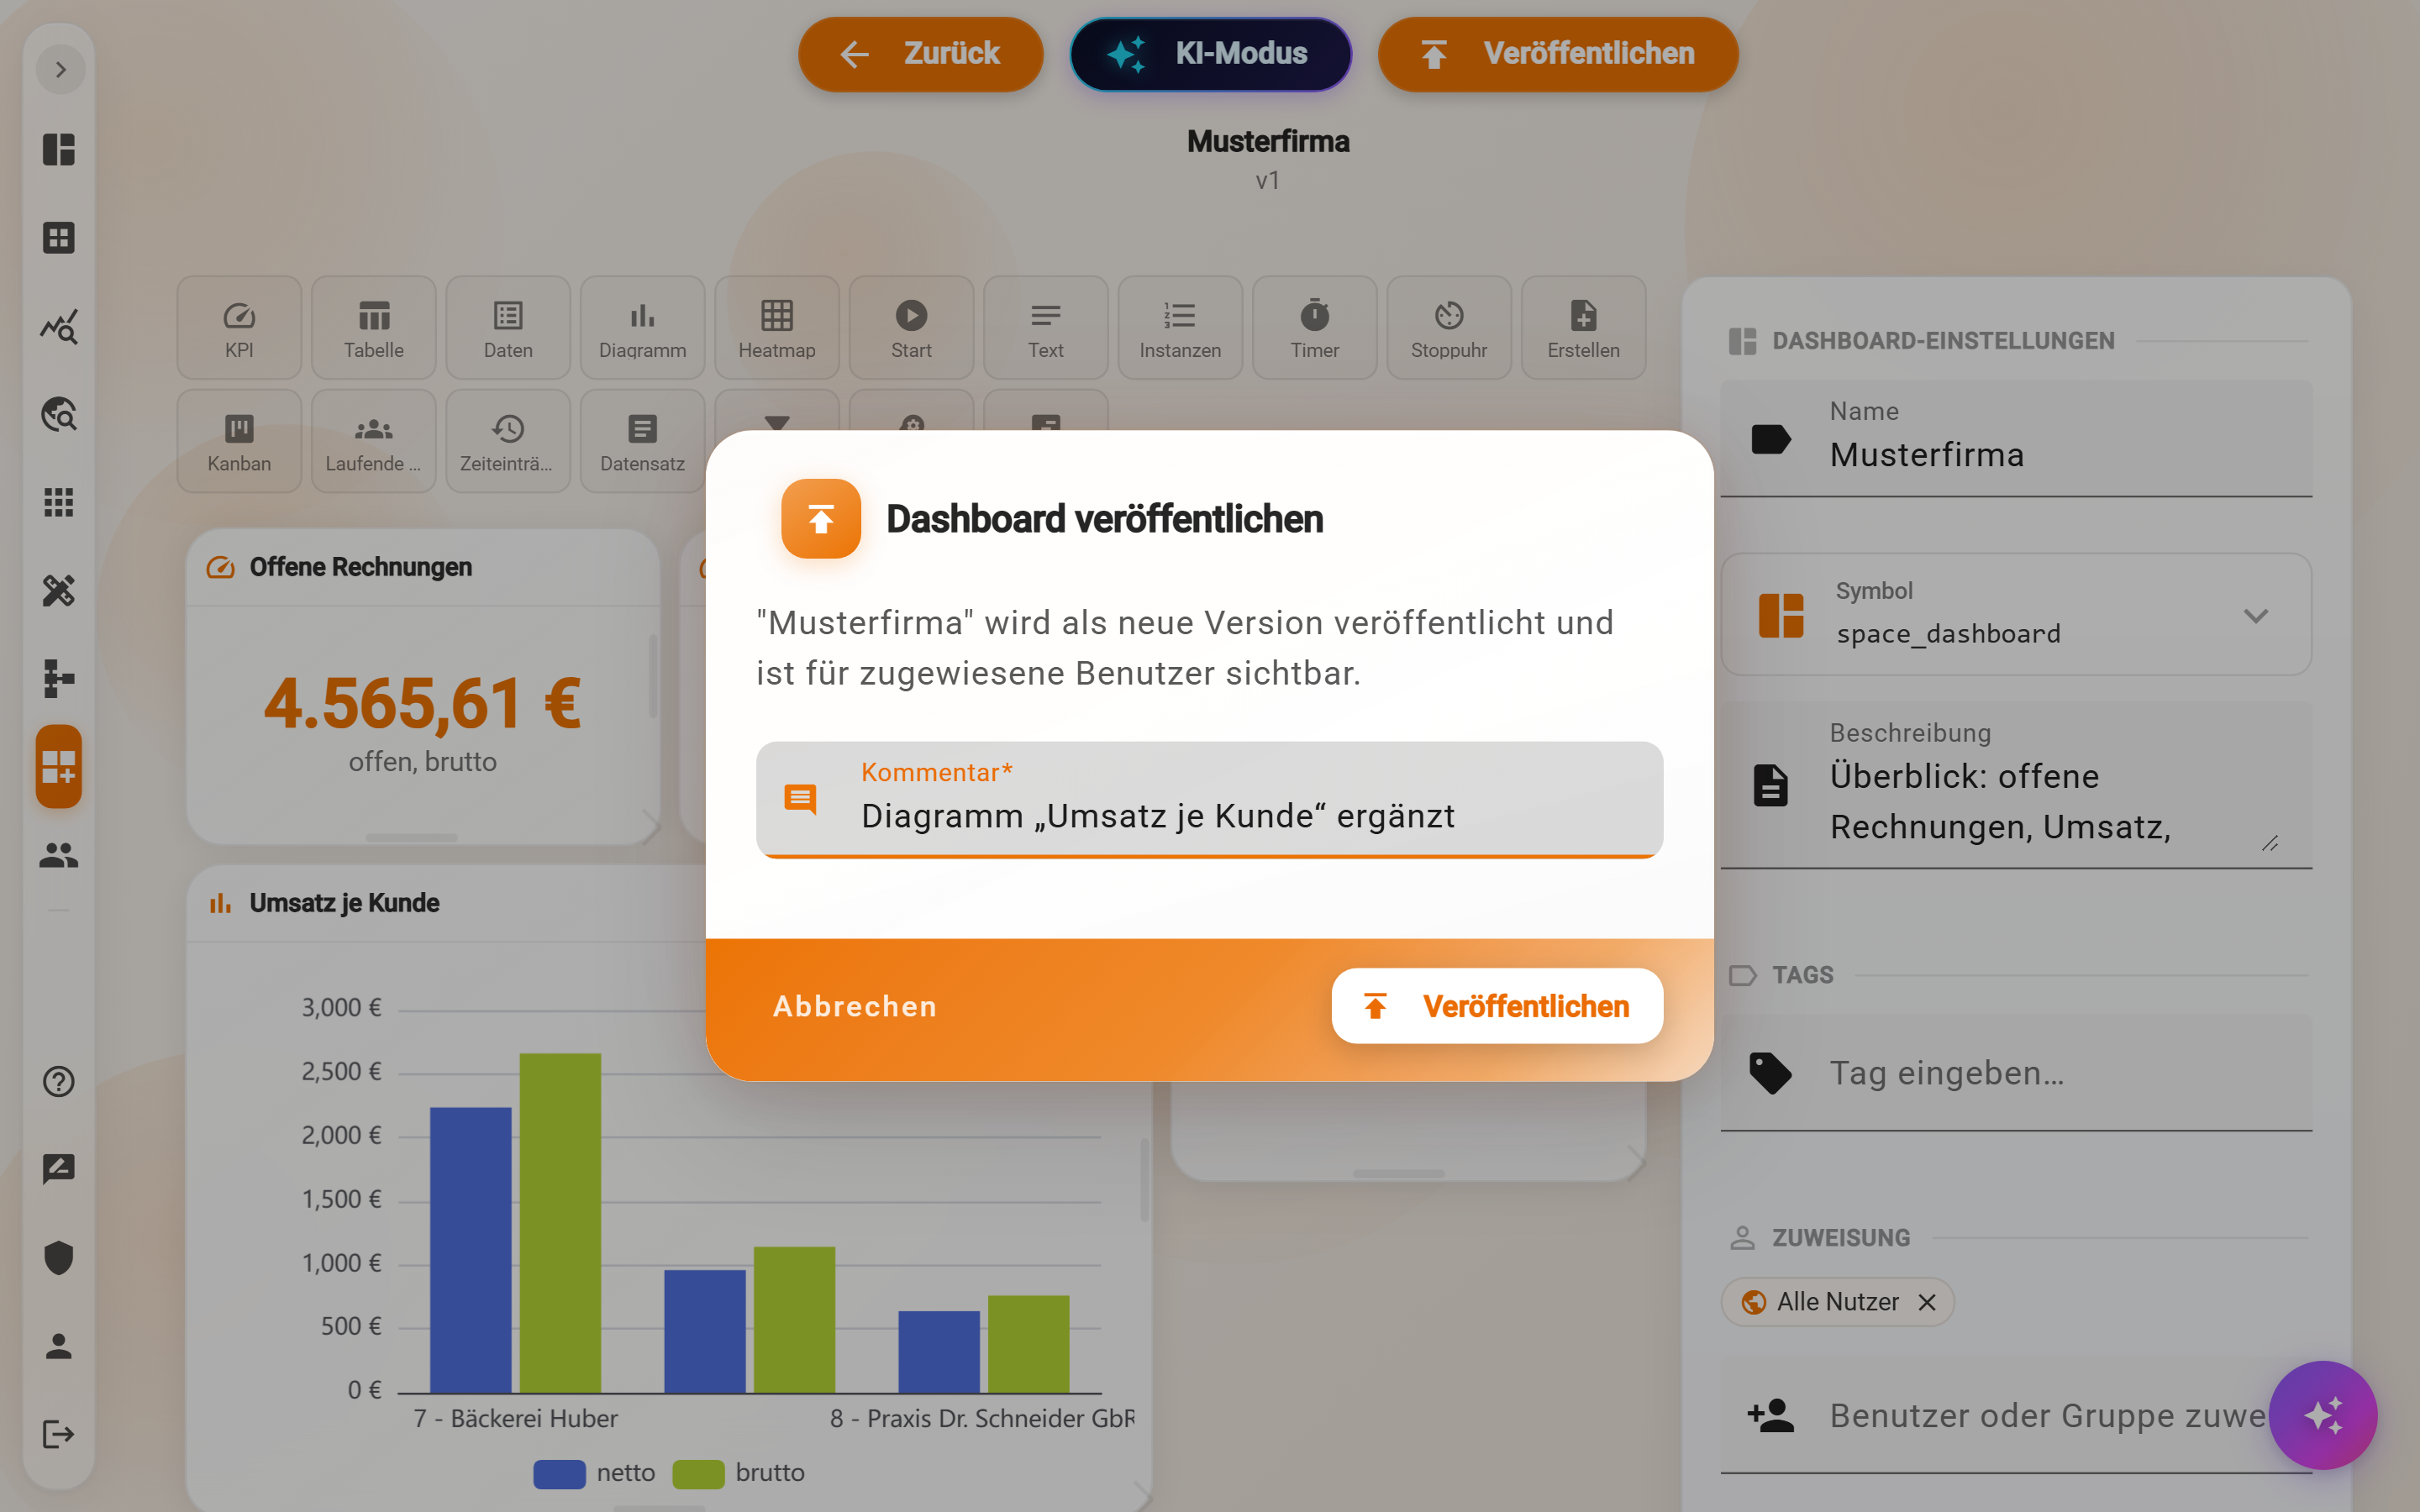
- Publish creates a new version from the draft with a mandatory Comment. Only now do assigned people see this state. Later changes remain a draft until the dashboard is published again.
- Versions shows the Version history: number, time and comment of every publication. There is no jumping back to an older version; instead the draft is adjusted and published again.
- Unpublish removes the dashboard from the workspace, the draft is kept. Delete removes it permanently with all versions and assignments.
- Export JSON shows the definition of the dashboard as text to Copy, for example as a backup or to hand it to an AI assistant.
Edit lock
A dashboard is edited by only one person at a time. If a second person opens the editor, This dashboard is currently being edited by … appears and the grid is read-only. Break lock takes over editing after confirmation; unsaved changes of the other person are lost. The lock ends on its own when the editor is left.
AI mode
AI mode shows the copy that a connected AI assistant is working on: a note at the top, and a click on a widget shows under AI changes what has changed on it, before and after. The own draft remains unchanged until the copy is adopted. Procedure and limits are described under Changing dashboards with the assistant.
On tablet and smartphone
On small screens the palette disappears; Add widget in the More actions menu opens the selection as a dialog, the settings appear as an expandable panel, and widgets are moved via Position & size with the arrows. On the smartphone the Designer is reduced to the essentials; building works best on the desktop.
Example
A dashboard “Bestellungen” (orders) is created for purchasing: New, name and icon
shopping_cart. From the palette a KPI (open orders), a Table (orders of the month) and a Start (reorder office supplies). Assignment: group Einkauf (purchasing). Publish with the comment “Erste Fassung” (first version). After a week a Chart is added and the draft is published as version 2.
Frequently asked questions
Users do not see the dashboard.
Three reasons: not published (badge Draft), person or group not assigned, or the dashboard was unpublished. All of this is visible in the list and in the Dashboard settings.
A widget shows “No data”.
The query returns nothing or the person is not allowed to query the table. Run the SQL query in Data analytics; the error message appears there as well. Check the permission Query of the data schema.
Are changes lost when the browser is closed?
No. The draft is saved after a few seconds; Saved below the name confirms it. It is not published by that, though.
Can a dashboard be copied?
Not with a button. Export JSON provides the definition; a connected AI assistant can set up widgets in a new dashboard from it in developer mode, or the widgets are created again by hand.
Next step
SQL in widgets: the rules for queries in KPI, Table, Chart and the like, then the pages of the individual widgets.