Data analytics
Data analytics is the SQL workplace of Pantarey: the tables on the left, the editor at the top, the result below. This is where questions are answered that no dashboard provides for, data is prepared for Excel, or queries are developed before they move into a widget. Whoever does not want to write SQL has the query generated by the AI or starts with a predefined query.
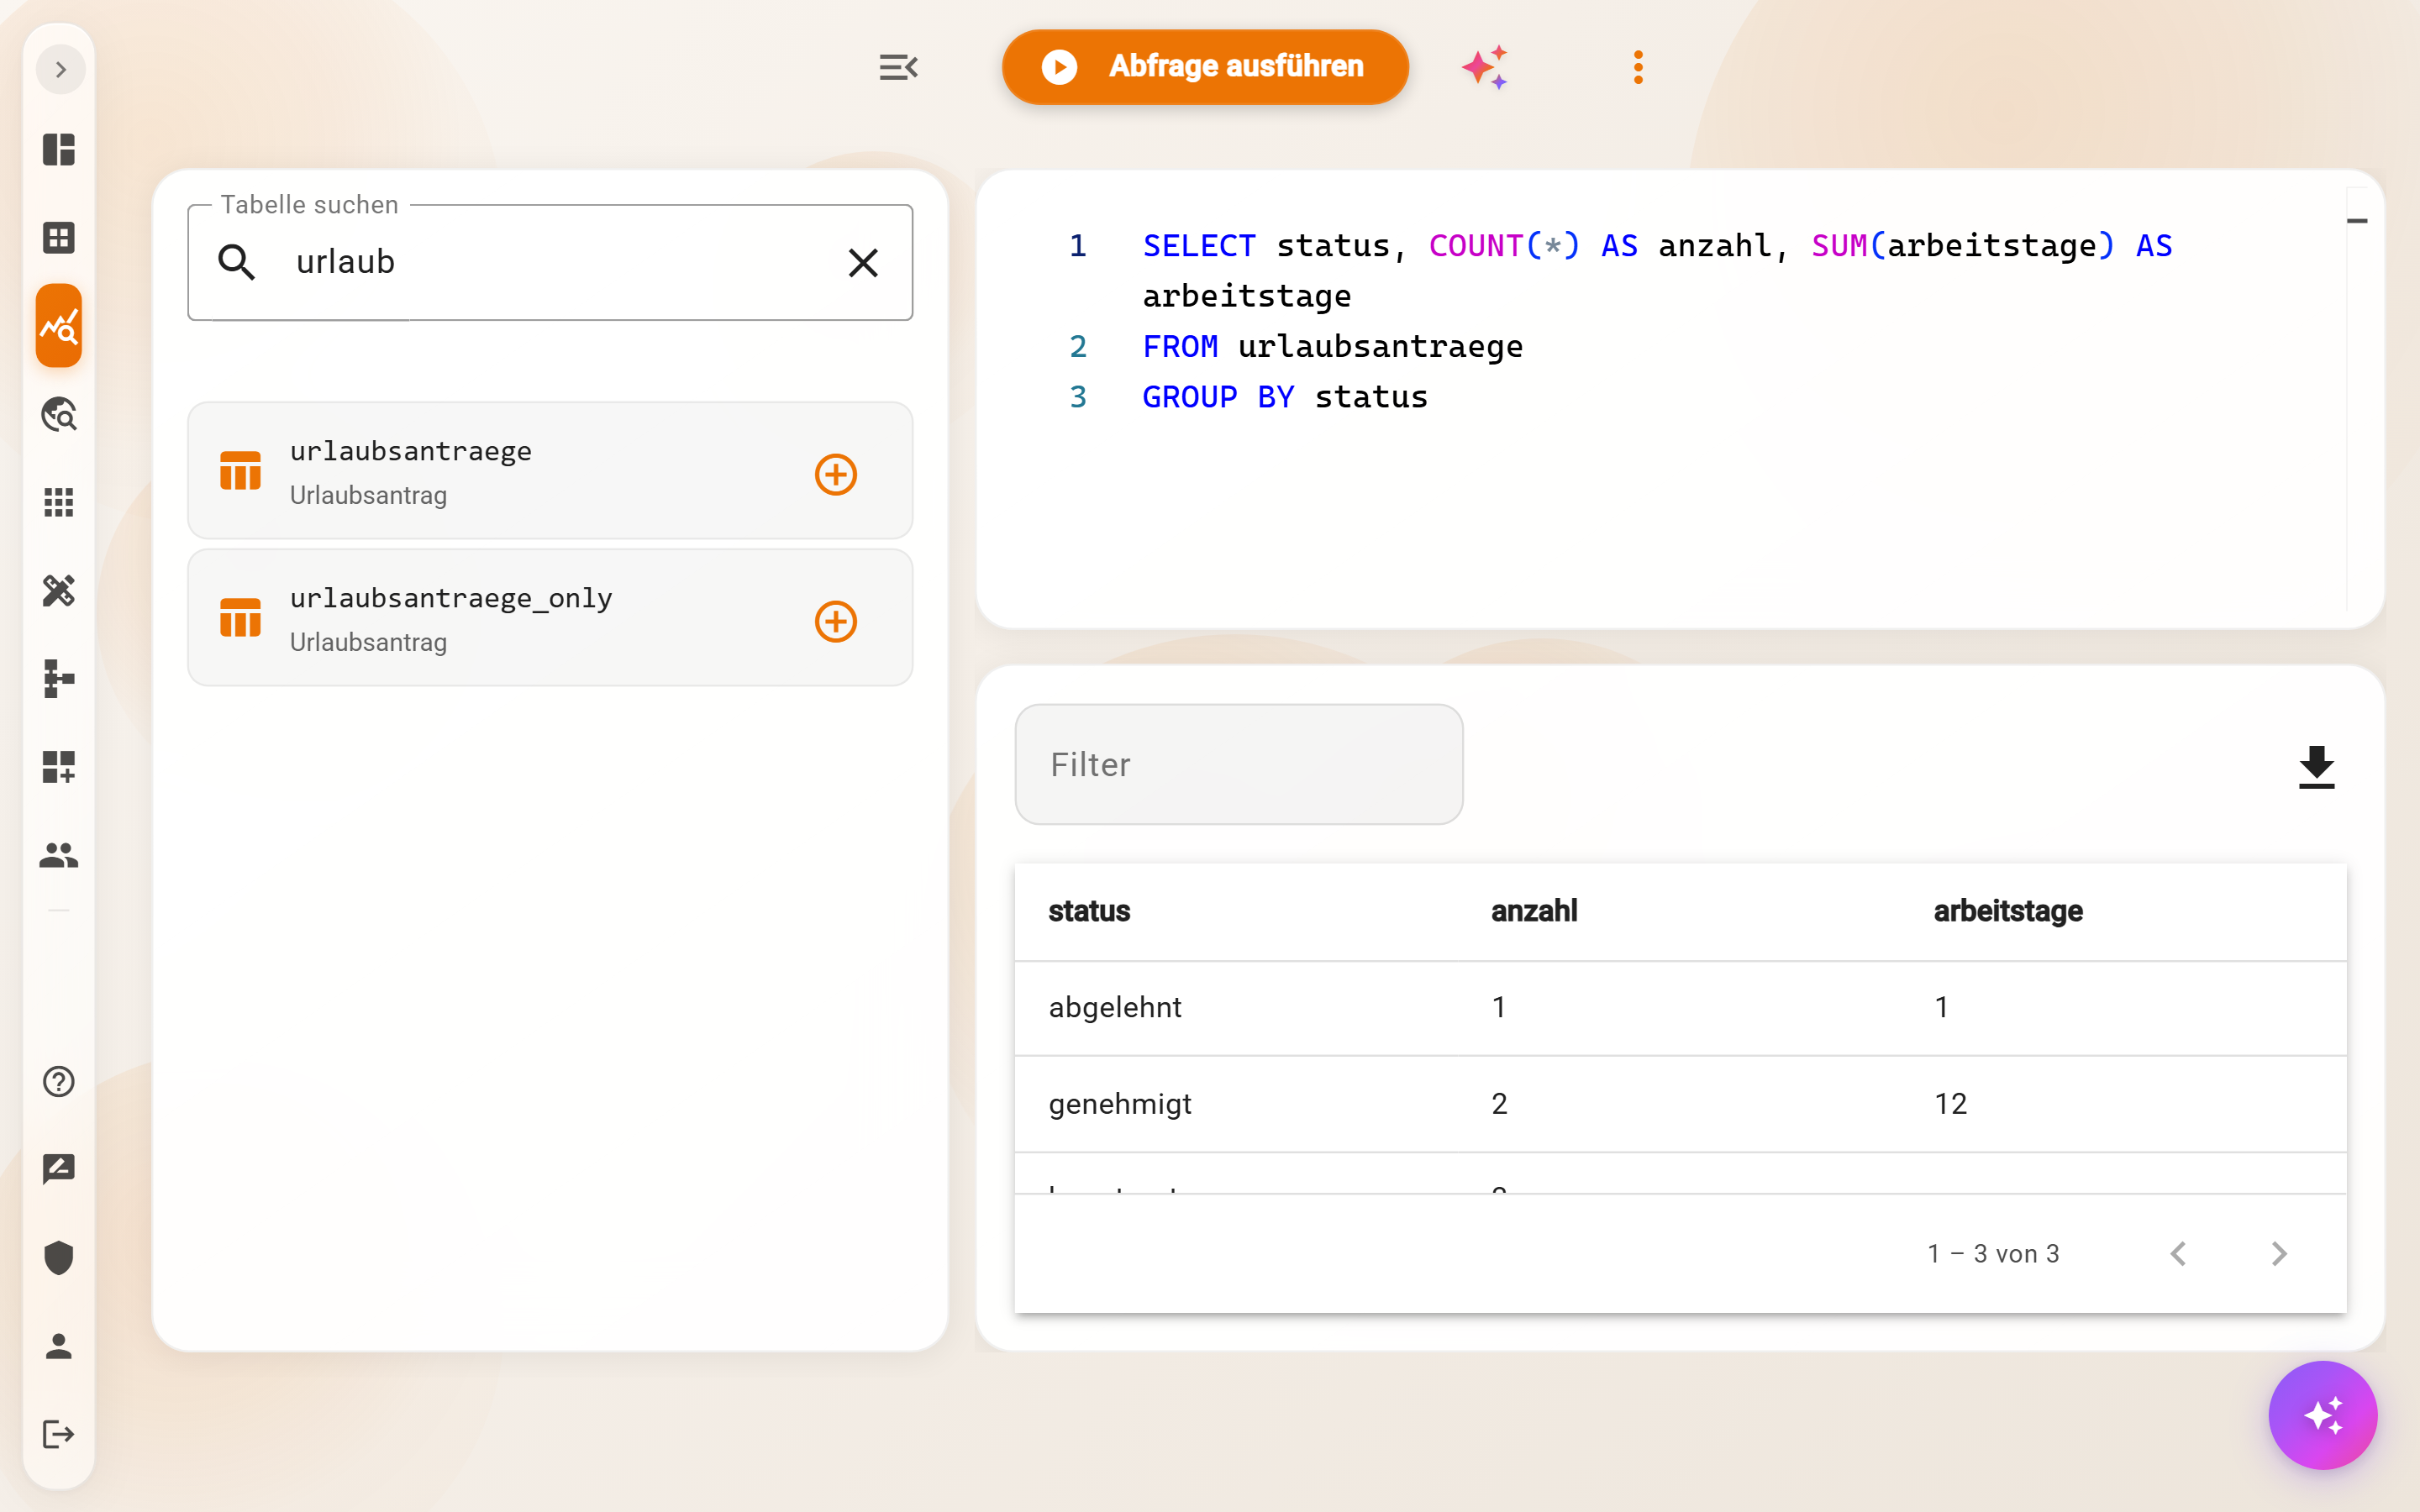
Layout
- Toolbar: Show tables displays the table list, Run query starts the query, the star icon opens the AI help, More actions (three dots) leads to the predefined queries.
- Table list: all tables that the own account may query, with technical name and display name. Search table filters, the plus icon inserts the name into the editor at the cursor.
- Editor: SQL with colors and completion; several lines are allowed.
- Result: the table with Filter, page navigation and Download.
On the smartphone, run, AI help and table list are in the menu More actions.
Tables
Every data schema is a table with the technical name of the schema; the columns are the technical names of the attributes plus id, data_schema_id, document_name, created_at, updated_at, created_by and updated_by. For every data schema there are two entries: name with the records of all subordinate data schemas and name_only with its own only (see Inheritance and hierarchies). System tables with the prefix prio_ are visible to administrators only. The quickest way to see which values a column contains is the predefined query Last 30 entries.
Writing and running a query
- Search for the table in the list and insert it into the editor with the plus icon, or type the name.
-
Complete the query, for example:
sql SELECT status, COUNT(*) AS anzahl, SUM(arbeitstage) AS arbeitstage FROM urlaubsantraege GROUP BY status -
Run query. While the query is running, the red icon Stop query stops it again.
Only reading is allowed: SELECT, also with JOIN, GROUP BY, subqueries and WITH. A table without permission is rejected before the start (“Access denied to: …”). After running, the query is in the address bar; the link can be sent to colleagues, who then find the same query in the editor. For date comparisons, numbers and empty values, the rules under SQL in widgets apply.
Result, filter and export
The result appears as a table with the columns of the query. Filter searches all columns for a text, the page navigation pages in steps of 5 to 100 rows, every cell has a Copy icon on hover. The Download icon offers three formats:
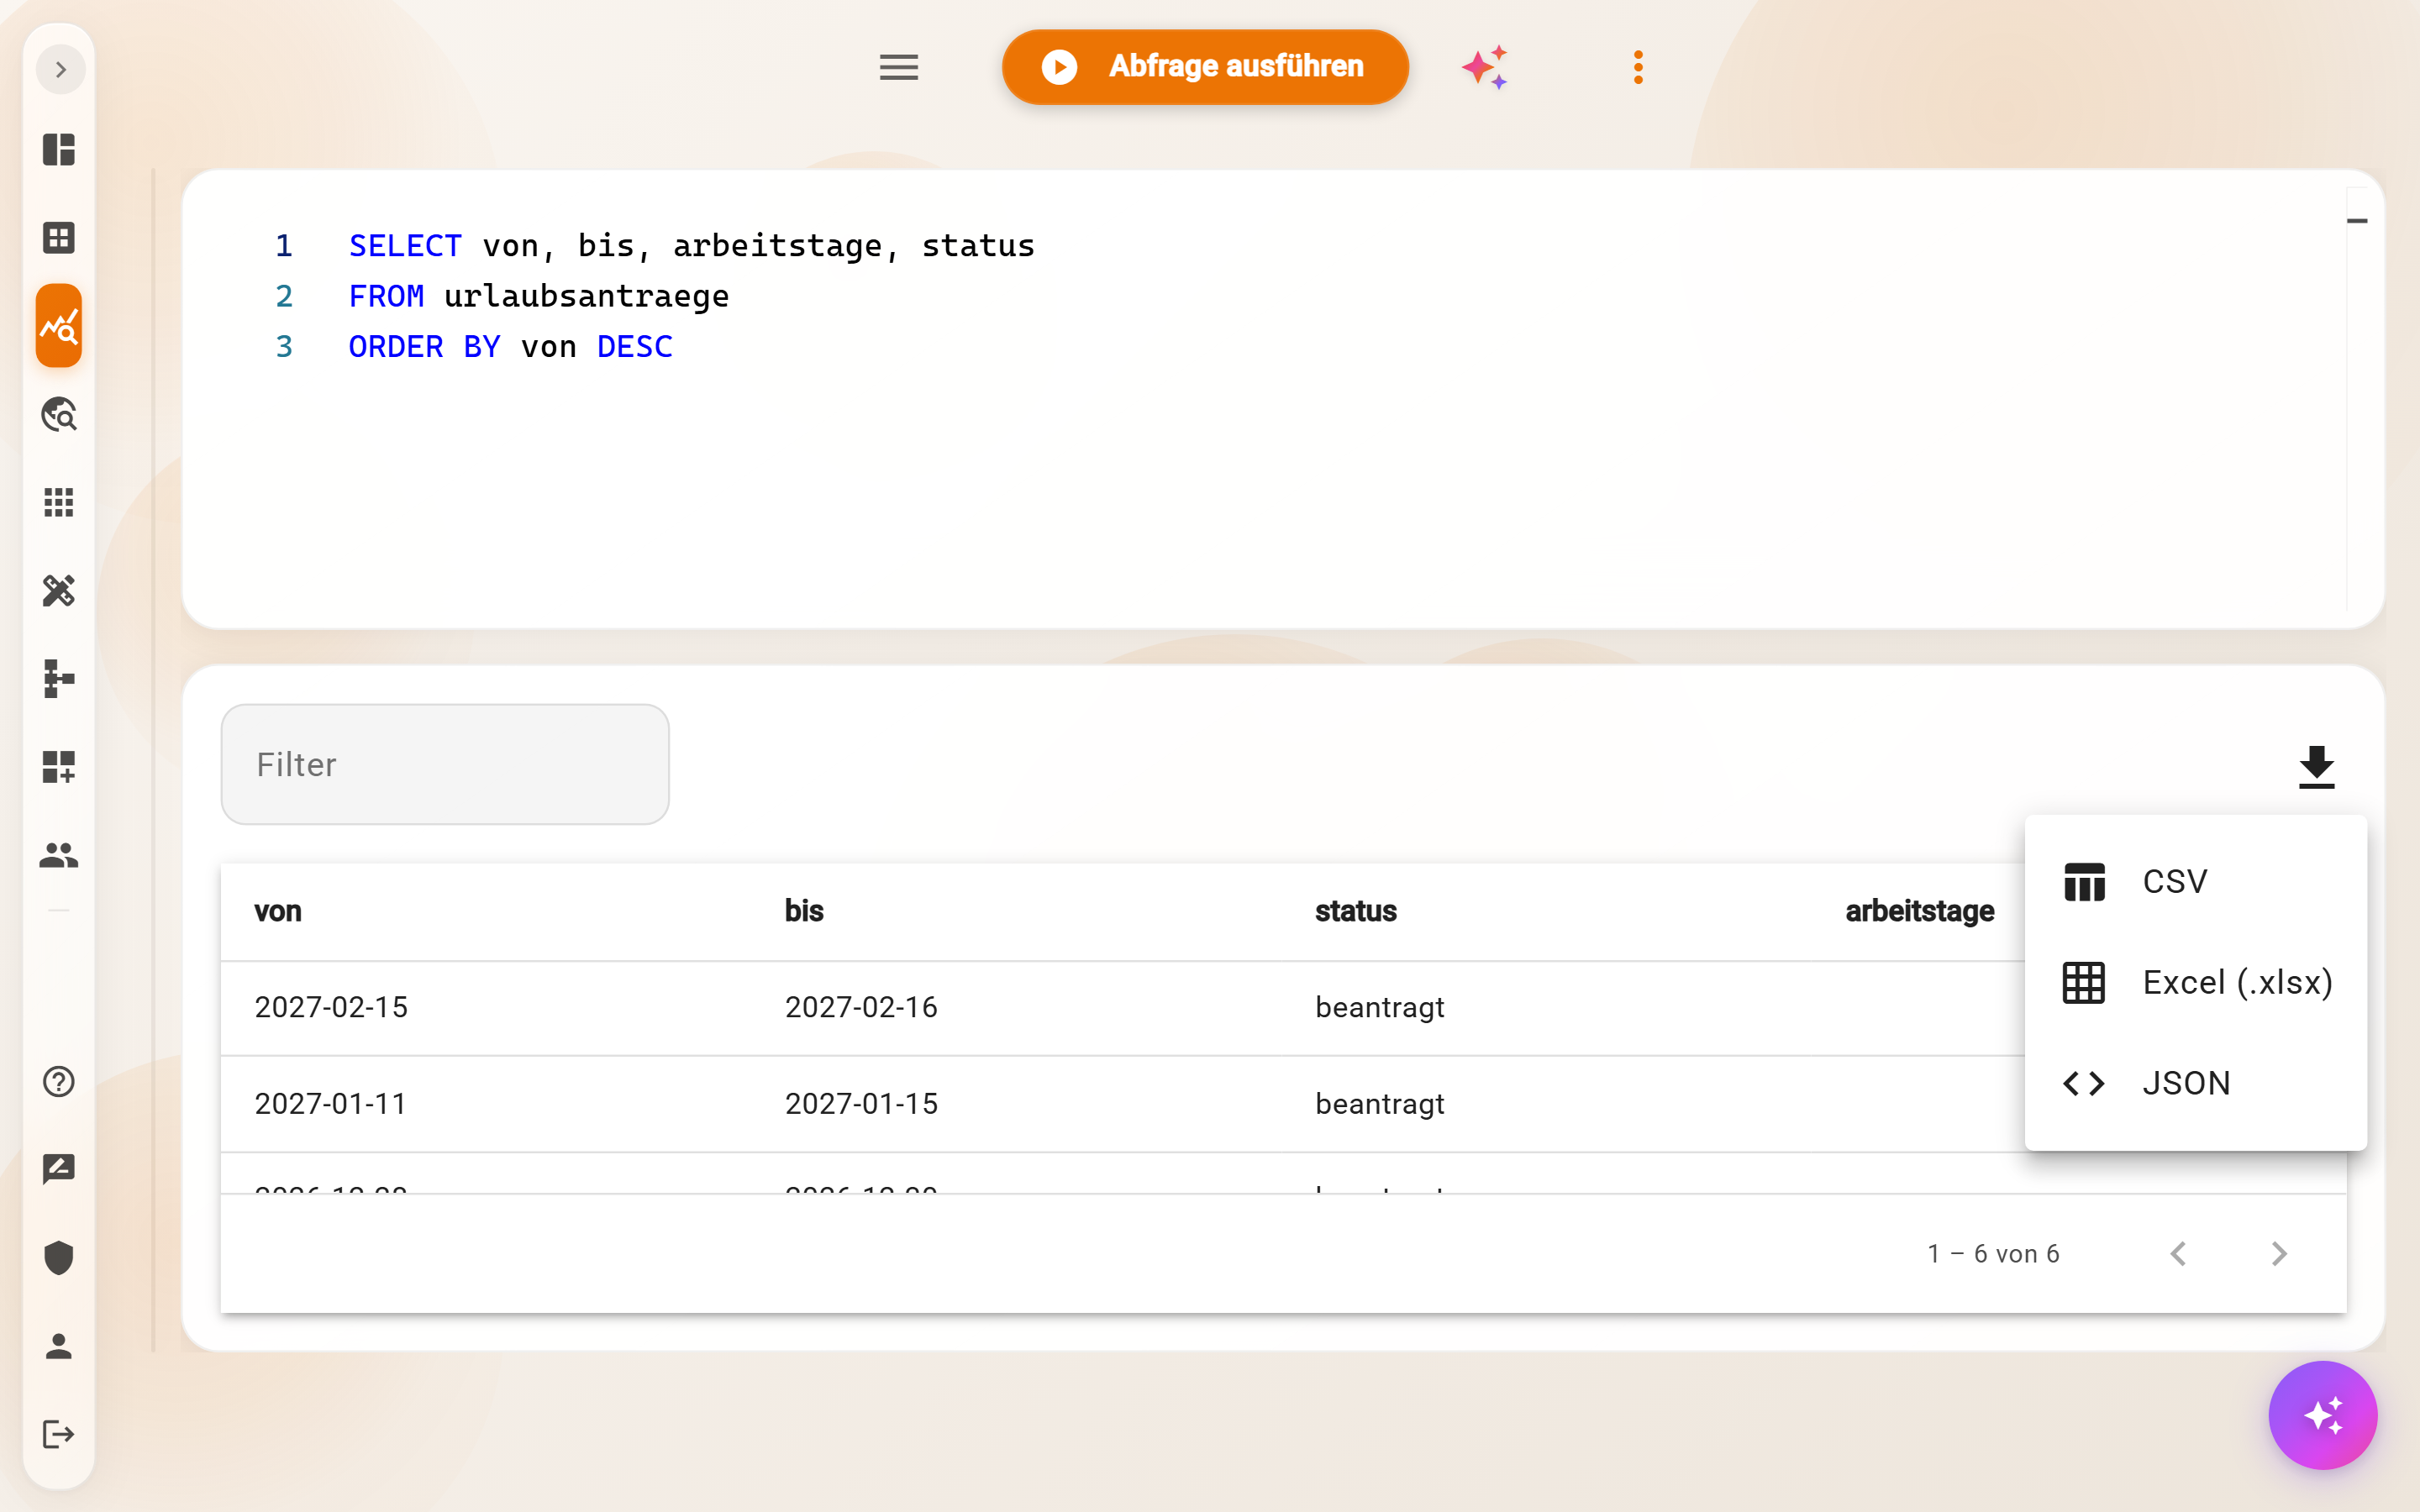
- CSV for imports into other programs,
- Excel (.xlsx) with number and date formats, ready for further calculation,
- JSON for developers and interfaces.
Exported is always the complete result of the query, regardless of filter and page.
Predefined queries
More actions → Saved queries opens the dialog Predefined queries. The arrow icon takes a query into the editor and runs it.
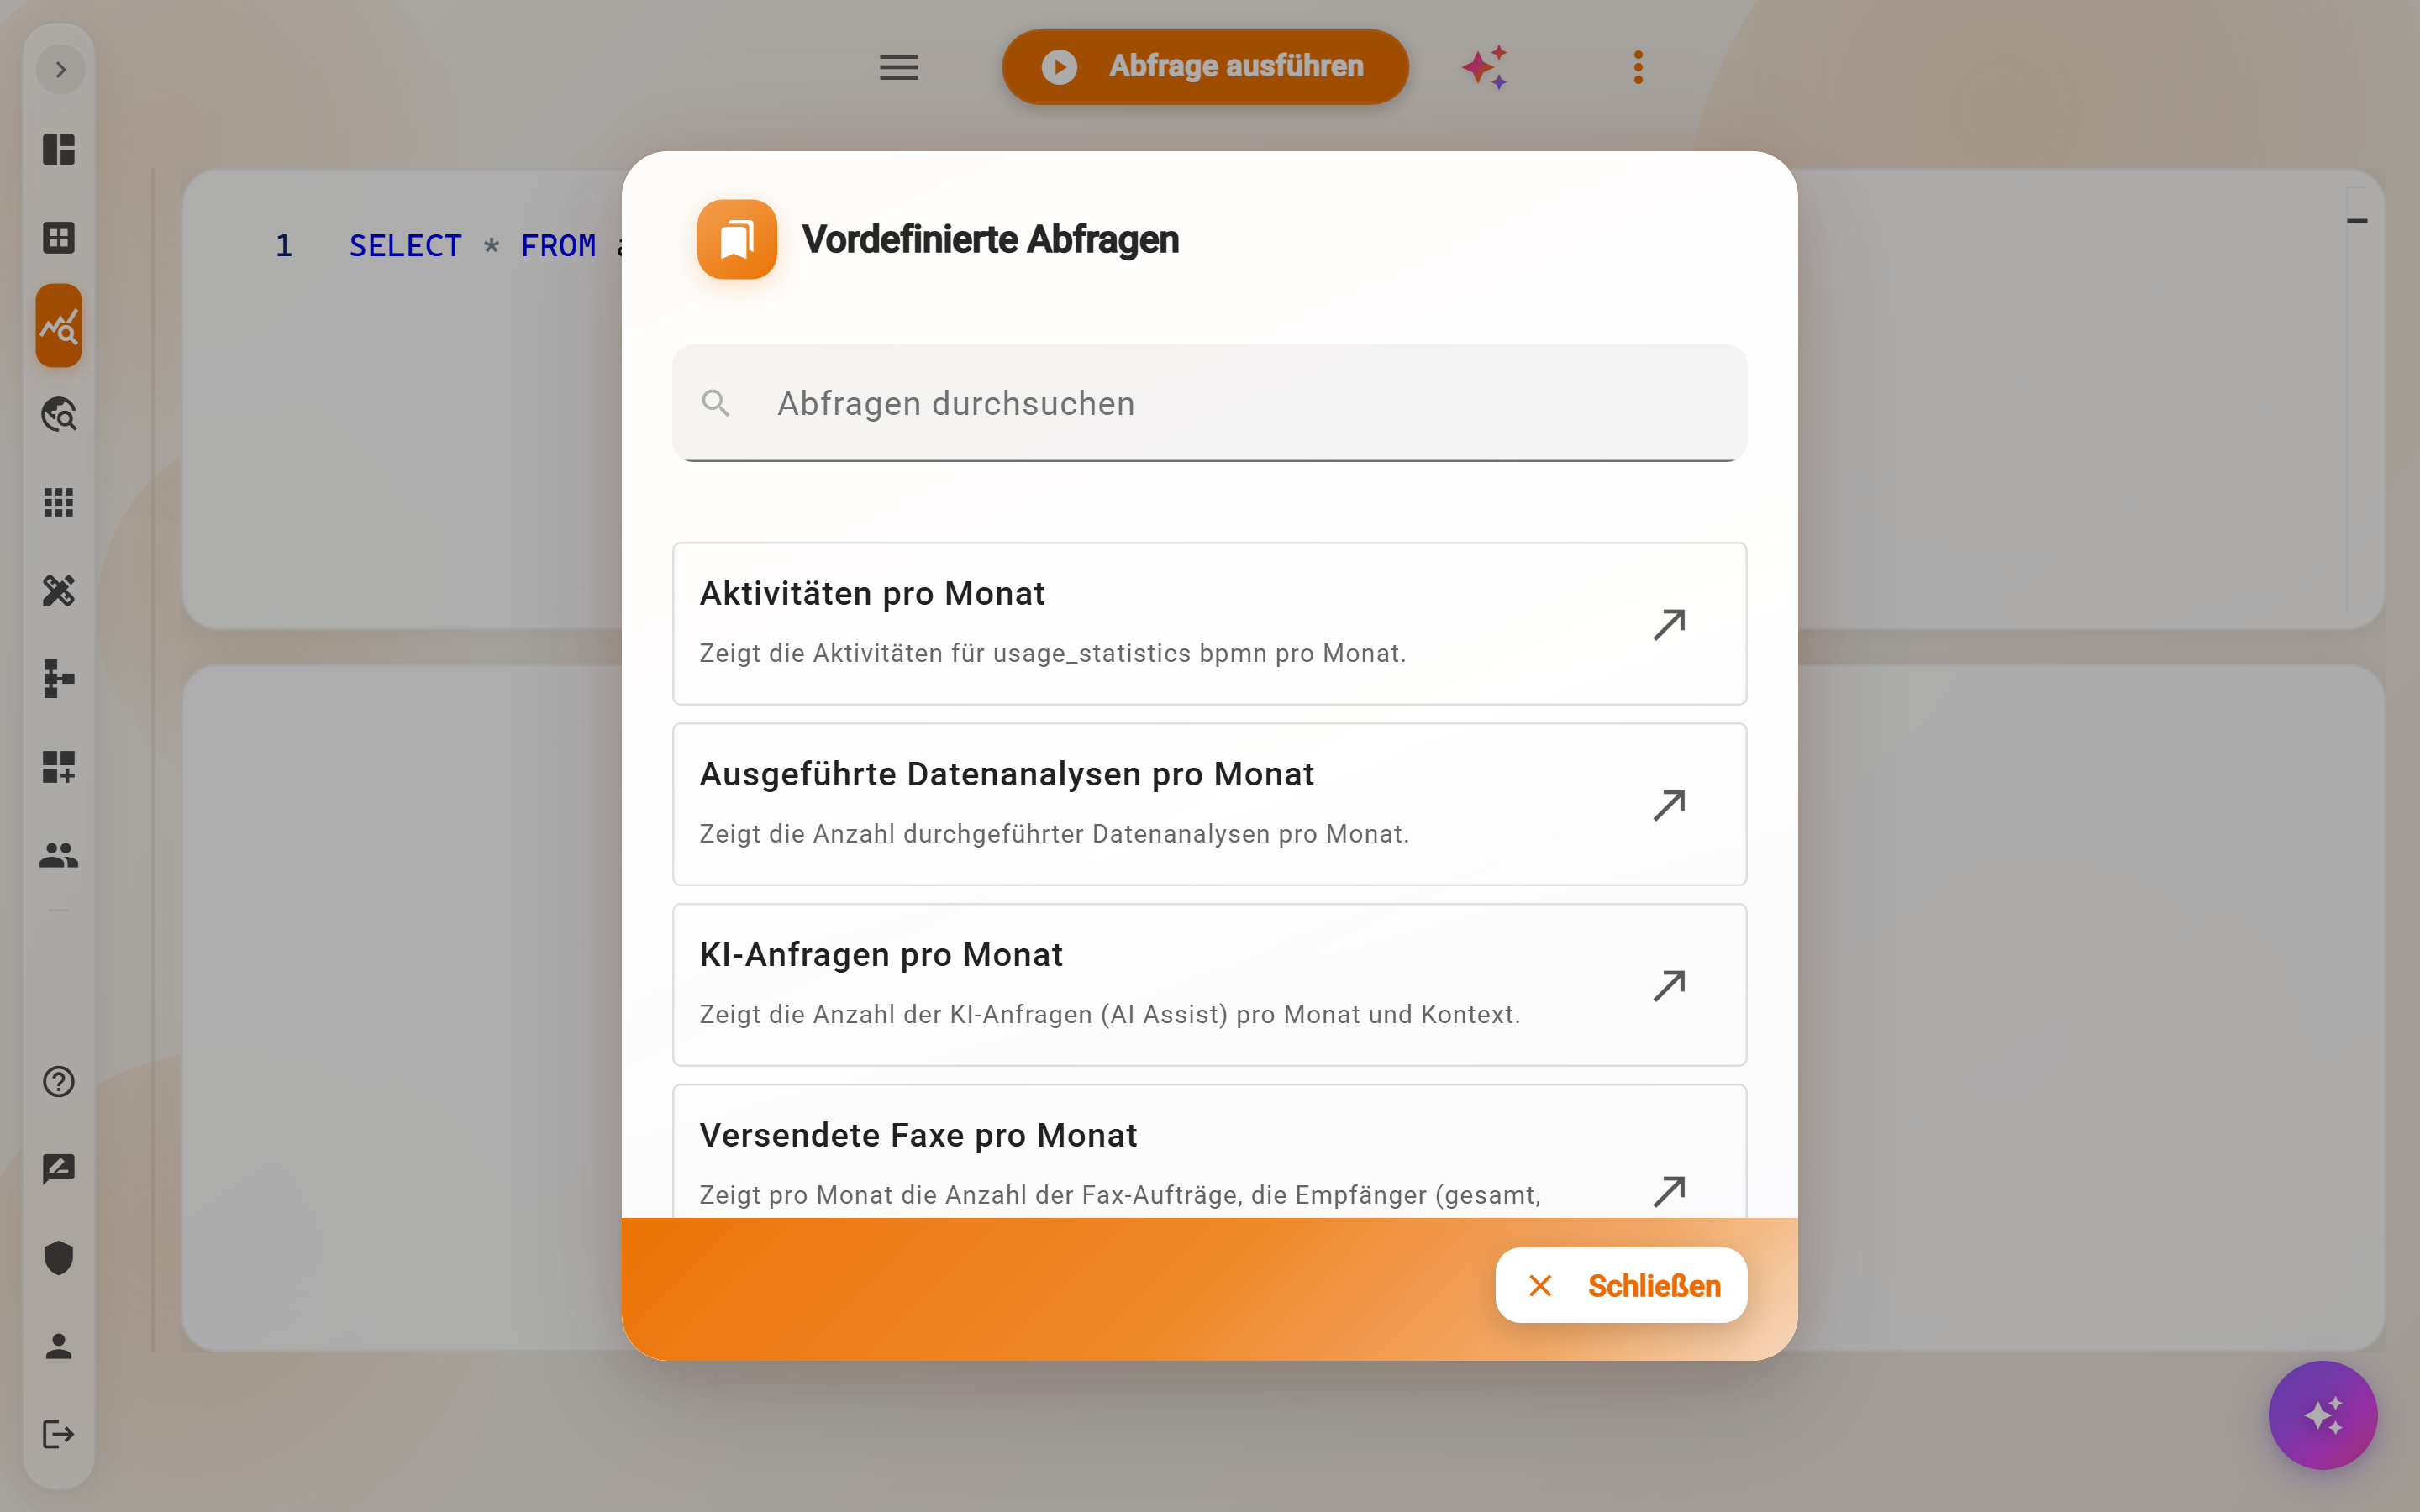
- Usage figures: Activities per month, Data analyses executed per month, AI requests per month, Faxes sent per month. They show how intensively the account is used.
- Templates (with 📋 or 🔍): Last 30 entries, Count per month, Text search, Group by with count, Full-text search. They contain placeholders such as
{{TABLE}}or{{DATE_COLUMN}}, which are replaced in the editor by the table and column name before the query runs.
SQL with AI
The star icon next to Run query opens the AI help. The question is entered in one's own words, below it the tables that come into question are ticked so that the AI knows their columns. Ask Panda generates the query, Apply puts it into the editor, where it is run and adjusted like any other.
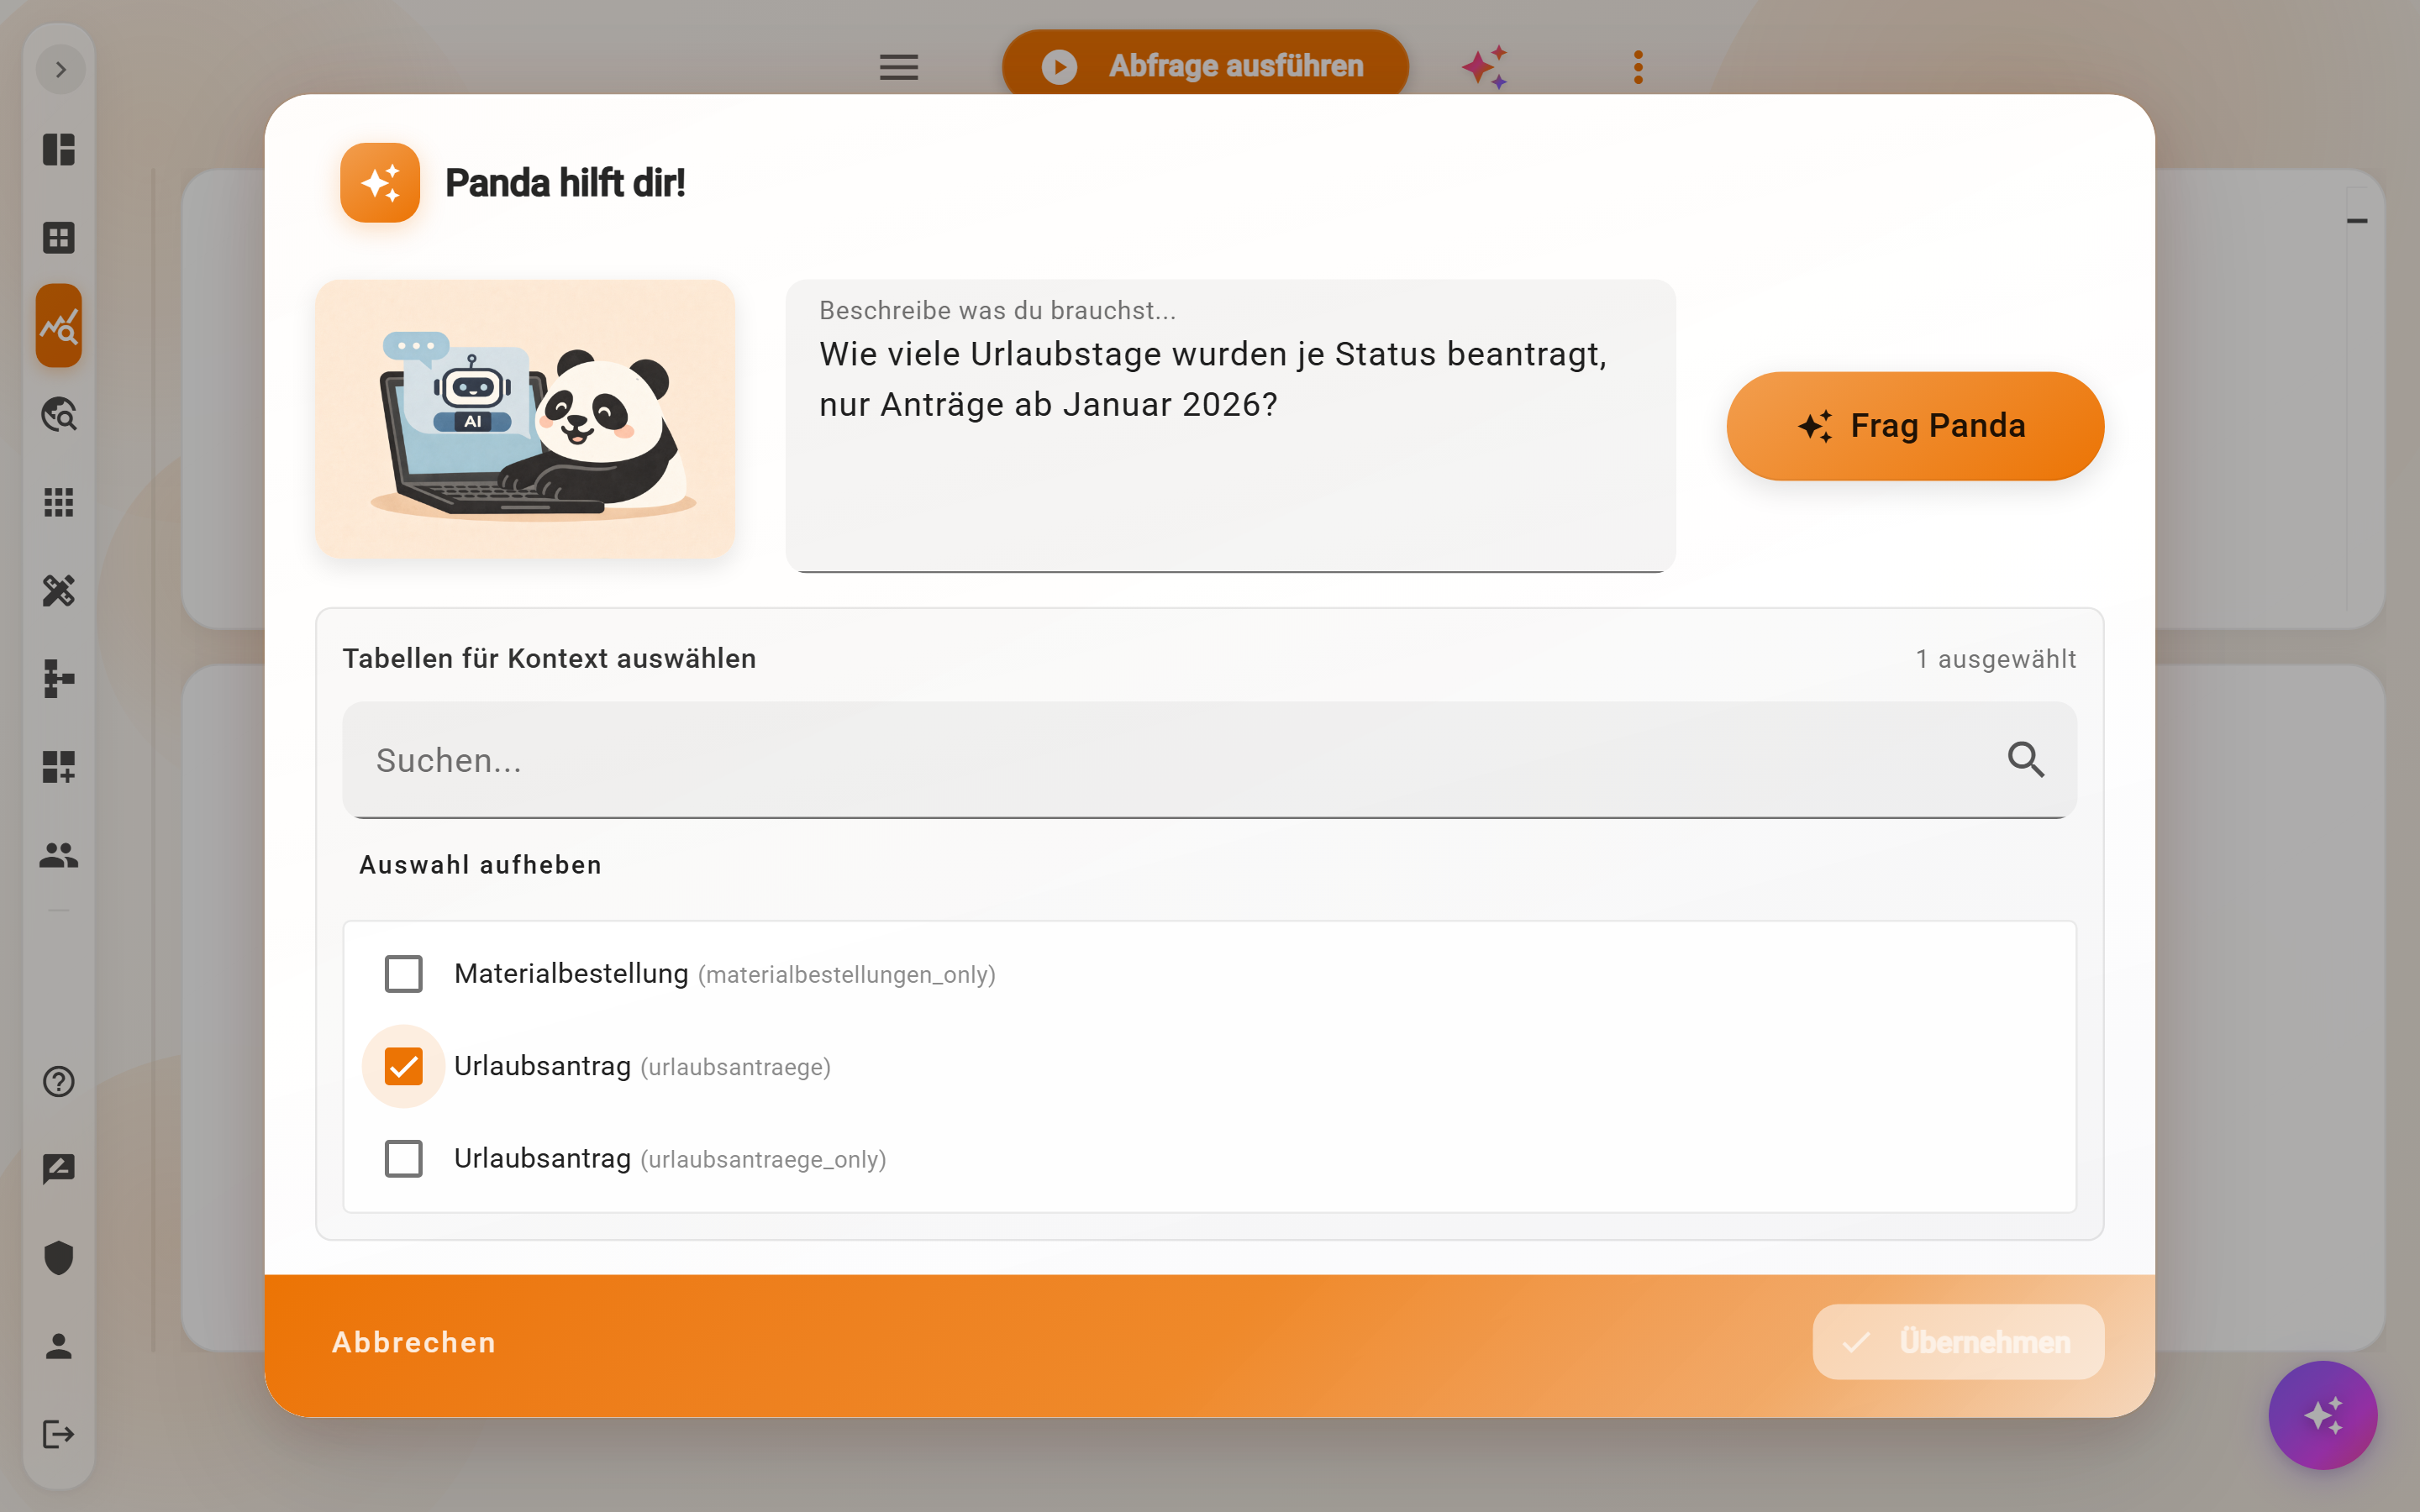
The more precise the question and the more fitting the table selection, the better the query. Before reusing it, a look at the result pays off: do period and status match the intention? Every call consumes AI tokens of the account. Whoever has an AI assistant connected can also ask the same question there and gets answer and query in the conversation.
Permissions
Data analytics opens for whoever has one of the roles Data queries (predefined) or Data queries (ad hoc); administrators assign them under Users → Manage users → Permissions. Which tables are in the list and which records a result contains is determined by the permission Query of the respective data schema, down to individual records if required. For SQL via AI assistant, Data queries (ad hoc) is a prerequisite.
Example
Purchasing needs all material orders of the month as Excel. In Data analytics:
SELECT artikel, menge, bemerkung, created_at FROM materialbestellungen WHERE created_at >= DATE '2026-11-01' ORDER BY created_at, run, Download → Excel (.xlsx). The file contains all rows with correctly formatted date values.
Frequently asked questions
“Access denied to: …” when running.
The permission Query is missing for this table. The administrator or the owner of the data schema can grant it in the Data Designer.
The result contains fewer records than the Database.
Permissions can exclude individual records, for example only one's own requests. Sums and counts then refer to the visible part. With name versus name_only, it also depends on whether sub-schemas are counted.
A date comparison returns an error.
A date field needs DATE '2026-01-01' instead of plain text; for timestamps TIMESTAMP. The details are under Comparing dates and timestamps.
Can a query change or delete data?
No. Data analytics works read-only; INSERT, UPDATE and DELETE are rejected.
Can an own query be saved?
Not in Data analytics itself. The link from the address bar contains the query and can be stored as a bookmark. For permanent evaluations, a dashboard widget is the better place.
Next step
Dashboards: show a proven query permanently as KPI, table or chart.