Monitoring processes
The Process Explorer is where process owners see what is happening in all processes of the company: how many instances are running, how many were successful, where something failed, and for every single instance which step ran when and with which data. From here, action is taken when an instance is stuck: resume, restart, cancel. The Overview in the left bar, by contrast, shows only what concerns the own account.
The overview
- Summary: one line in words, such as “9 executions in total across 5 processes. Most frequent: Rechnung erstellen (6×). No failed processes.” With an elevated failure rate, that is stated here first.
- Period: Today, Last 14 days, This week, This month, This year. All figures refer to the selected period.
- Search: filters the table by process name.
- Table: per process Total, Running, Successful and Failed, sortable by clicking the column. A click on the row opens the instances of the process.
- Designer opens the process in the Process Designer, Docs generates the process documentation.
Shown are all processes of the account, including those without their own start tile, such as subprocesses like “Einzelnen Lieferschein verarbeiten” (process a single delivery note).
The three levels
- Overview: all processes with figures. This is where it becomes visible that something is wrong.
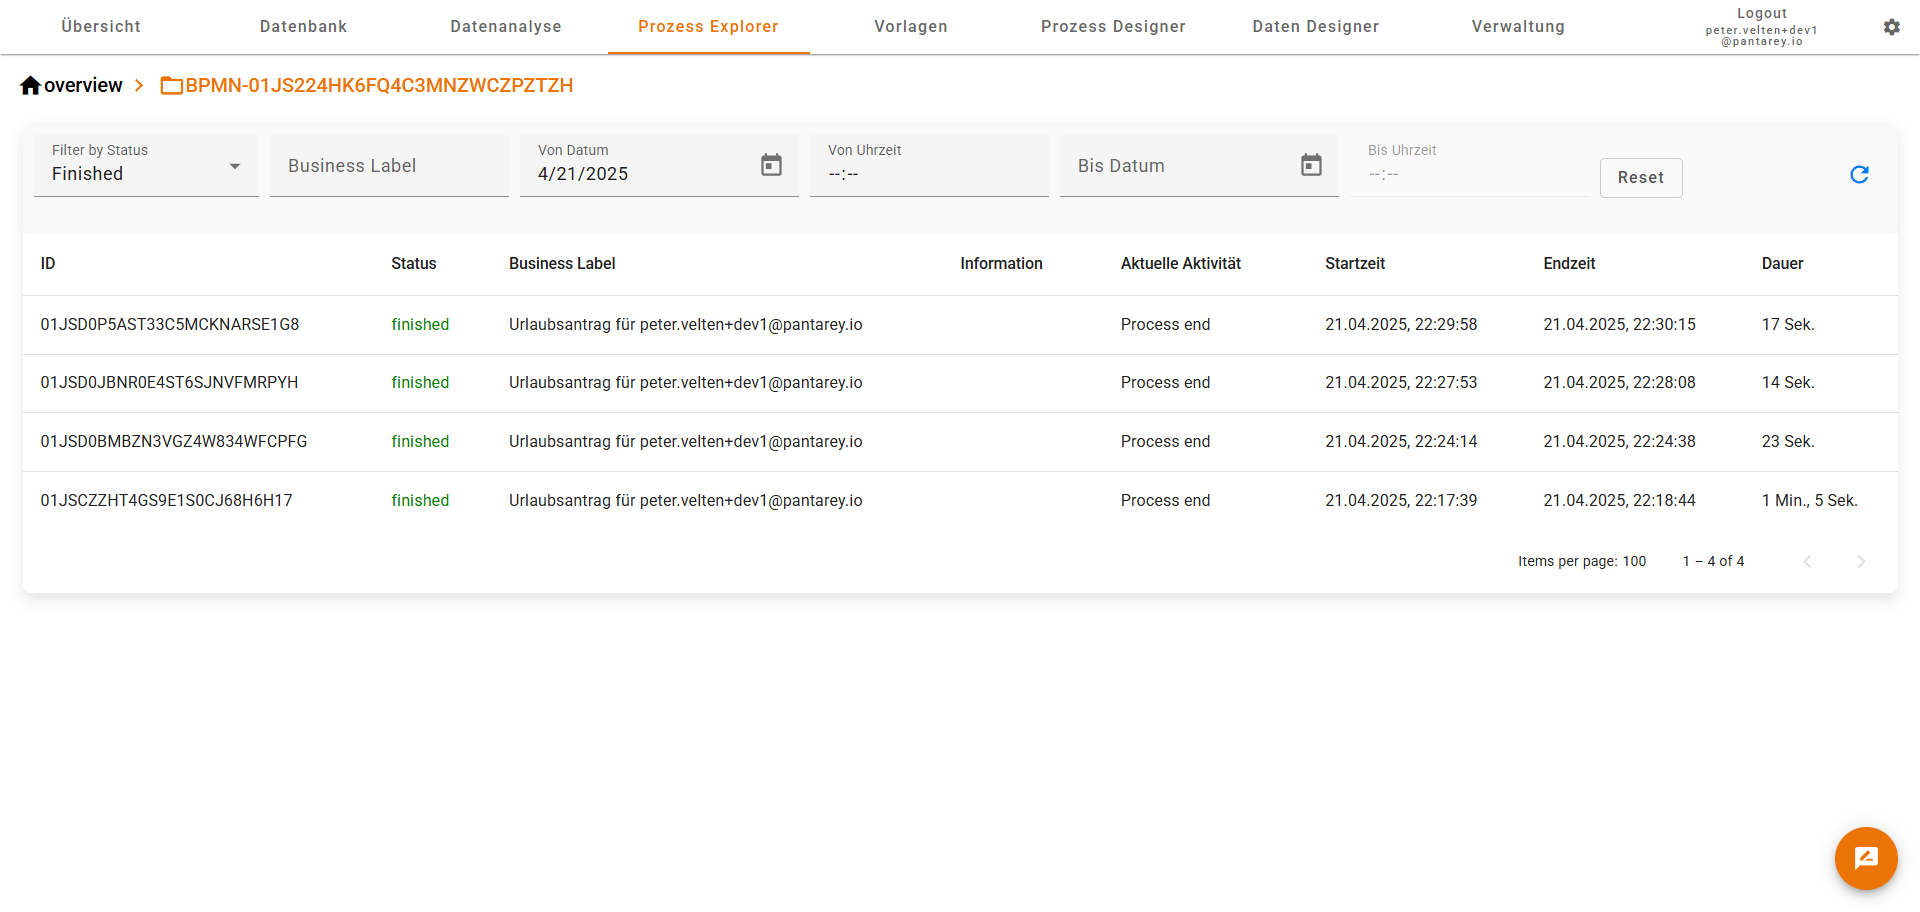
- Instances of a process: the list of instances with status, business label, current activity and duration, filterable. See Instances of a process.
- Instance details: one instance with diagram, key data, all steps and their data. This is where action is taken. See Instance details and Actions.
The breadcrumbs at the top lead back at any time: Overview → Process → Instance.
Who sees the Process Explorer
Three roles, assigned by the administrator under Users → Manage users → Permissions, grade the access: Process Explorer (Overview) for the figures, Process Explorer (Instances) for the instance lists, Process Explorer (Instance details) for the details with the actions. A connected AI assistant can query the same information (“Which instances failed today?”), provided the account has these roles.
What the Process Explorer is not
For one's own tasks and cases there is the Overview, for evaluations of the stored data Data analytics and the Dashboards. The Process Explorer shows the technical run of the processes; its instances are hidden from the lists after 60 days, the stored records remain in the database.
Frequently asked questions
A process shows a red number. What now?
Click the row, filter the list by status Failed, open the instance. The error is under Message, the red step in the diagram shows where. Then resume or restart.
The figures do not match the Work overview.
The Work overview in the Overview counts only what concerns the own account and has its own periods. The Process Explorer counts all instances of the account.
A process is missing from the list.
The table shows all processes that are deployed. A process that exists only as a draft in the Designer appears after deploying.
Next step
Instances of a process: filter the list and find the right instance.